TL;DR
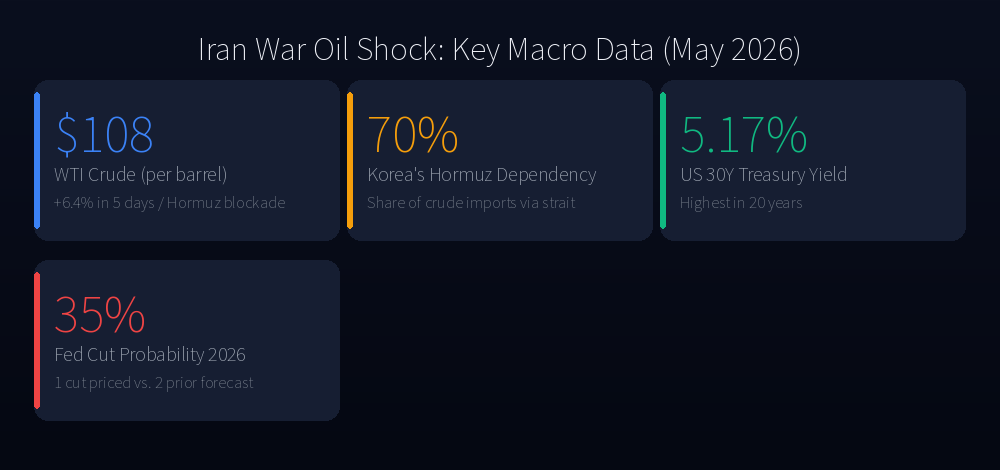
- $108 WTI: Hormuz blockade (since March 4) has pushed crude up 6.4% in 5 days — this is a supply shock, not demand-driven.
- Korea is the most exposed: 70% of Korean crude imports transit the strait — OECD cut Korea’s growth forecast the most of any major economy (-0.4pp).
- Fed is stuck: Only 35% odds of even one rate cut in 2026. The 30Y UST yield hit 5.17% — a 20-year high. TQQQ longs are bleeding carry.
$108 Oil Is Not a Commodity Story. It’s a Macro Regime Change.
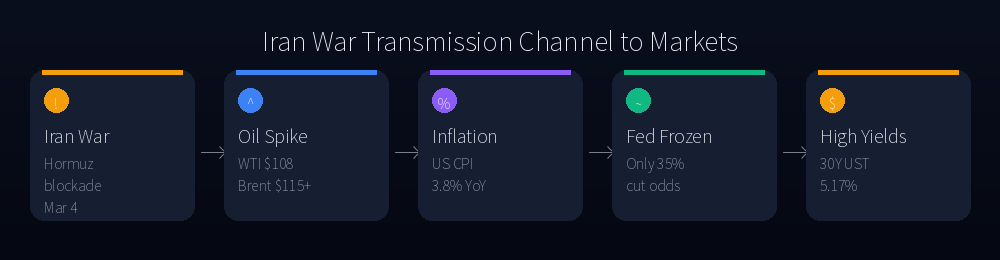
On May 19, WTI crude closed at $108.59/barrel, up 6.4% in five sessions. The catalyst isn’t demand. It’s supply: the Strait of Hormuz has been functionally blockaded since March 4 following the escalation of the US-Iran conflict. Brent briefly crossed $120 at the peak; it has since pulled back to the high $100s, but the forward curve has repriced structurally.
The Dallas Fed estimates that even a one-quarter blockade duration raises US headline CPI by 0.6 percentage points and core CPI by 0.2 points. US gasoline averaged $4.50/gallon as of May 12, with CPI running 3.8% year-on-year — the largest 12-month jump since May 2023.
This is textbook stagflation setup: supply shock raises prices while simultaneously dragging on real growth. History is not encouraging. Ten of the last 12 US recessions were preceded by a significant oil price spike.
The Asymmetric Exposure Map
Not all economies are created equal when crude spikes. The US, since the shale revolution, is a net crude exporter. Higher oil prices raise domestic energy sector profits and partially offset the consumer burden. The S&P 500’s energy weighting is less than 5% — manageable.
Korea is structurally different. 70% of Korean crude imports transit the Strait of Hormuz. Japan sits at roughly 60%; China around 35%; the US at effectively zero. When the strait tightened on March 4, the KOSPI fell 12% in a single session — triggering a circuit breaker — its worst single-day drop since the 2008 financial crisis. Peak drawdown reached 16% before partial recovery.
The OECD responded by cutting Korea’s 2026 growth forecast by 0.4 percentage points — the steepest downgrade among major economies — and raising its inflation projection to 2.7%. The transmission mechanism is direct: energy cost surge → manufacturing margin compression → trade balance deterioration → KRW depreciation.
Why the Fed Can’t Move — The Oil Inflation Dilemma
The Federal Reserve faces a structural dilemma that has no clean solution. Fed doctrine holds that supply-side inflation shocks — oil, weather, logistics — should not be countered with rate hikes. The logic: tightening can’t produce more oil. Hiking into a supply shock risks crushing demand without fixing the underlying price pressure.
But prolonged elevated oil also raises inflation expectations. If households and corporates start pricing in persistent $4.50+ gasoline, the second-round effects (wage demands, services inflation) become self-fulfilling. The Fed is watching for exactly this feedback loop.
The market verdict: futures price only a 35% probability of even one Fed rate cut in 2026, down from two cuts expected before the conflict. Rate hike odds have crept back into pricing for the first time since the early Warsh era. The 30-year Treasury yield hit 5.17% — the highest since 2006. The 20-year touched 5.19%.
1970s vs. 2026: The Comparison That Matters
Bear analysts are reaching for the 1970s playbook. The superficial parallels are real: oil supply disruption driven by Middle East conflict, the Fed caught between growth and inflation, a pre-existing government deficit complicating the policy response.
The differences matter more, however. The US energy balance has inverted since then. Shale production means domestic energy companies capture the windfall rather than exporting it. The financial system is better capitalized. And the Fed’s inflation-fighting credibility, while tested, is far higher than it was under Burns and Miller.
The 1970s comparison lands hardest on energy-importing nations — Korea, Japan, India — not the US. For these economies, the current shock is structurally analogous to 1973-79, with limited domestic buffers.
My Verdict and Positioning
I am defensively positioned until there is credible evidence of Hormuz normalization.
Specifically:
-
TQQQ and leveraged tech ETFs: Reduce or hedge. At 30Y yields of 5.17%, Nasdaq valuations face sustained multiple compression. Leveraged ETF volatility decay is punishing at current volatility levels. These instruments are not designed for extended hold periods in high-rate, choppy environments.
-
Energy equities (XOM, CVX, XLE): Overweight relative to historical allocation. These act as a portfolio hedge against further oil-driven drawdowns in growth equity. The correlation is structurally negative to tech — useful diversification right now.
-
Dollar-denominated assets: Maintain. KRW depreciation against USD provides a natural carry advantage for overseas investors holding US-listed securities. For Korean retail investors in US markets, the current FX dynamics are net-positive.
-
Korean chipmakers (Samsung, SK Hynix): Watch but don’t chase. They recovered significantly on the AI semiconductor cycle; the current level already discounts significant good news. Energy input cost inflation is a real headwind to margins, and any further KRW move complicates the picture for USD-reporting subsidiaries.
-
KOSPI broadly: The index has recovered to ~6,000 from the March 4 low. Year-end 8,000 scenarios exist if Hormuz normalizes. That upside is real but conditional. I would not add until there is a visible de-escalation signal in the strait.
The single variable that resolves this trade is the Strait of Hormuz. Everything else is noise.
Investment Disclaimer: This analysis is for informational purposes only and does not constitute investment advice. All investment decisions and associated risks are the sole responsibility of the reader. Past performance does not guarantee future results.