
TL;DR
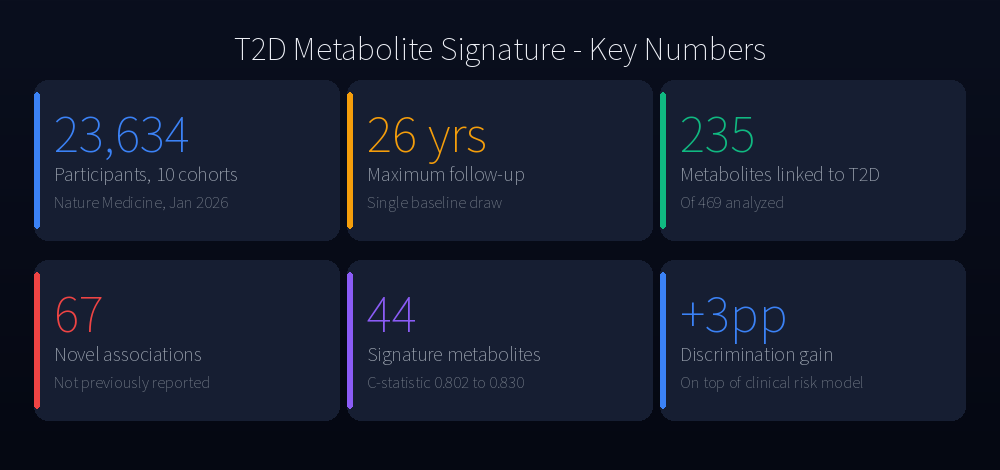
- The Study: An integrated analysis of 23,634 initially diabetes-free adults across 10 cohorts, followed for up to 26 years, identifies 235 blood metabolites that track future type 2 diabetes — 67 of them previously unreported.
- The Signal: A 44-metabolite signature pushes the c-statistic of a clinical risk model from 0.802 to 0.830, with most of the gain coming from re-classifying people whose standard tests look normal.
- The Takeaway: The pathways involved — bile acid, urea cycle, glycine, histidine — are heavily shaped by diet, weight and physical activity, meaning the signature looks less like fate and more like a record of behavior.
A Normal Glucose Reading Is Not the Whole Story
For most patients, a fasting glucose of 95 to 99 mg/dL on an annual physical lands in the “normal” column. Hemoglobin A1c of 5.5%? Also normal. The chart gets filed, and the next visit is a year away.
A paper published in Nature Medicine on January 14, 2026, suggests that this routine misses a meaningful slice of future patients. Jun Li, MD, PhD, of Brigham and Women’s Hospital and Harvard Medical School, and colleagues integrated metabolomic, genomic and lifestyle data from up to 23,634 initially type 2 diabetes (T2D)-free adults pooled across 10 cohorts, with follow-up reaching 26 years. Of 469 circulating metabolites analyzed, 235 were associated with incident T2D, including 67 associations that had not been previously reported (Li et al., Nature Medicine, 2026; DOI: 10.1038/s41591-025-04105-8).
The metabolites span pathways that go well beyond the classical glucose-insulin axis: bile acids, lipids, carnitines, the urea cycle, arginine/proline, glycine and histidine.
Deep Dive: How the Signature Actually Works
This is the section where the methodology matters, because the headline number — a c-statistic improvement from 0.802 to 0.830 — is easy to wave away as small.
The Methodology
The study is not a single cohort. It pools data from ten longitudinal studies including the U.S. Nurses’ Health Study (NHS), Health Professionals Follow-up Study (HPFS), the European Prospective Investigation into Cancer (EPIC) sites, and other validated cohorts. That design has two consequences:
- Cross-cohort replication is built in. A metabolite-T2D association observed in NHS but not seen in EPIC gets penalized; the 235 metabolites that survived had to clear that bar.
- Adjustment is aggressive. The team controlled for age, sex, BMI, smoking, diet, physical activity, family history, blood pressure, and a polygenic risk score for T2D. Some analyses applied Mendelian randomization to probe causal directionality.
After all of that, 235 metabolites remained associated with incident disease. That is not a fragile correlation pattern; it is a robust signal across populations and decades.
The Pathway Story
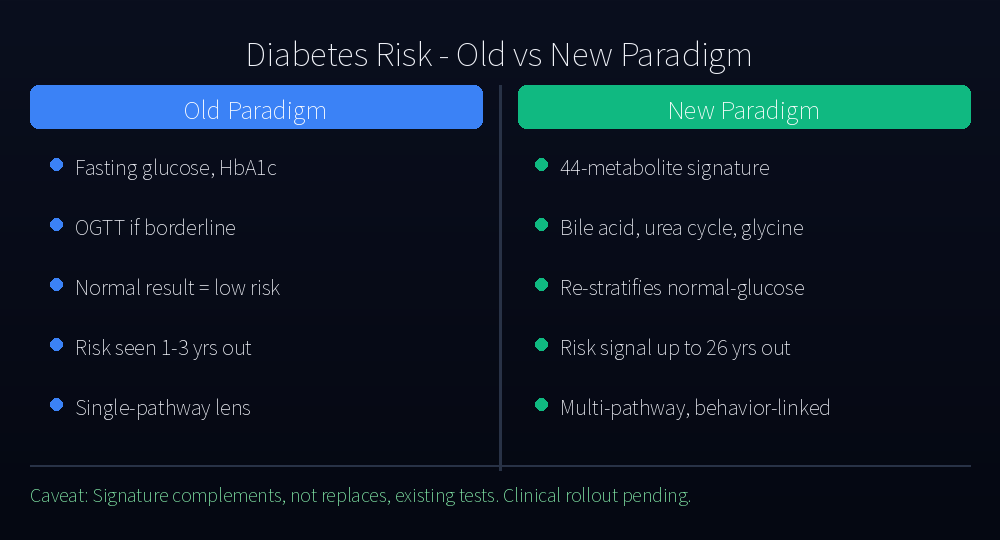
What makes this work novel is not just the count but the biological terrain. Old paradigm: T2D is a disease of glucose and insulin, with some lipid involvement. New paradigm, supported by this dataset:
- Bile acid metabolism. Bile acids, classically known for fat absorption, also signal through FXR and TGR5 receptors that regulate insulin sensitivity, energy expenditure and the gut microbiome. The new study shows specific bile acids prospectively flagging T2D risk years before clinical diagnosis. This is consistent with the gut-liver-metabolic axis now receiving heavy attention.
- Urea cycle and amino acid metabolism. The urea cycle handles ammonia from protein turnover. Intermediates such as arginine and citrulline showed associations with T2D — a reminder that protein handling and metabolic flexibility are not separate from diabetes risk.
- Glycine and histidine pathways. These amino acid pathways link to one-carbon metabolism and inflammation, both of which are increasingly tied to insulin resistance.
Where the 44-Metabolite Signature Gains Power
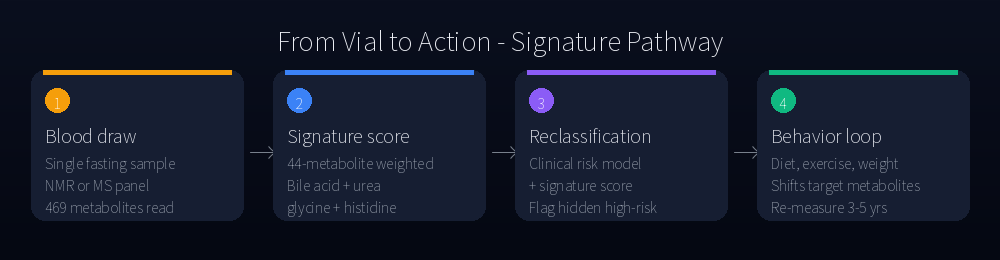
The authors selected 44 metabolites that, combined, formed a predictive signature. When added to an established clinical risk model, the c-statistic rose from 0.802 to 0.830. On the surface, three percentage points. In practice, the gain is concentrated in reclassification — moving individuals out of the “low risk” bin into a “monitor closely” bin, particularly those whose standard tests look reassuring.
A useful analogy: A model that bumps overall accuracy by 3 points might do so by getting a few obvious cases right. But a model that does so while re-stratifying ambiguous cases is more clinically valuable, because that is exactly where current screening fails.
Competing Hypotheses: Genetics vs. Behavior
A central question in T2D research is how much of disease risk is genetically programmed versus shaped by daily life. This study leans hard on the behavior side. Three findings push in that direction:
- Lifestyle factors — physical activity, body weight, and diet — explained greater variation in T2D-associated metabolites than in non-associated ones. In other words, the metabolites that matter for disease prediction are also the ones most responsive to behavior.
- A polygenic risk score was included in the model. The metabolite signature added independent predictive value on top of genetic risk, suggesting the metabolome reflects something different from inherited risk alone.
- Mendelian randomization analyses pointed to plausible causal roles for several metabolites, rather than treating them as passive correlates.
The implication is consequential: a metabolite signature that worsens over a decade is not a “you were born with it” verdict. It is, at least in part, a ledger of behavior — and ledgers can be re-written.
Caveats
The authors and accompanying coverage flag several limitations honestly.
- Ancestry skew. The 10 cohorts are predominantly European-descent populations. Generalizability to East Asian, African and Latin American populations needs explicit validation, especially since East Asian populations show insulin secretion patterns and lean-mass-adjusted insulin resistance distinct from European populations.
- Single time-point measurement. Baseline blood draws are projected forward across decades. Whether longitudinal metabolite trajectories add information remains untested.
- Clinical readiness. Standardized assays for routine clinics, reimbursement pathways, and cost-effectiveness analyses are not yet in place. This is a research-grade tool, not a 2026 lab order.
- Effect-size translation. A c-statistic gain of 0.028 is statistically robust but clinically modest in isolation. The case is for reclassification of borderline patients, not wholesale replacement of HbA1c.
What This Means For You
The metabolomic panel is not at your doctor’s office yet. But the science has implications you can act on today.
- Treat fasting glucose of 90 to 99 mg/dL as a “watch zone,” not “all clear.” Mechanism: insulin resistance precedes glucose elevation by years. Action: if you sit in this band with a family history of T2D, ask your physician about HbA1c plus fasting insulin (to estimate HOMA-IR). Dosing/frequency: re-measure annually, compare trend lines rather than single values.
- Add 7 to 10 grams of fiber per meal. Mechanism: fermentable fiber fuels gut microbes that produce short-chain fatty acids (SCFAs) and shift bile acid pools toward more insulin-sensitizing forms (Reynolds et al., Lancet, 2019). Action: swap part of your refined grains for oats, barley, or legumes; add one plate of vegetables per meal.
- Lift weights twice a week. Mechanism: skeletal muscle is the largest insulin-target tissue. Building muscle improves postprandial glucose disposal and amino acid handling. Dosing: two 30-to-45-minute resistance sessions per week, focused on compound movements; meta-analyses show HbA1c reductions of roughly 0.4 percentage points over 12 weeks in at-risk adults.
- Finish dinner at least three hours before sleep. Mechanism: late eating misaligns circadian glucose handling and shifts melatonin against insulin secretion. Action: aim to close the eating window earlier; Sutton et al. (Cell Metabolism, 2018) showed improved insulin sensitivity within 5 weeks of early time-restricted feeding even without weight loss.
- Read your annual labs as a series, not a snapshot. Mechanism: a glucose value drifting from 88 to 94 to 99 mg/dL over three years is informative, even if every single reading is “normal.” Action: keep a simple spreadsheet of your annual values and flag any sustained upward trend to your physician.
The Bigger Picture
For decades, T2D screening has been a sniff test at the loudest end of the spectrum — fasting glucose, HbA1c, the oral glucose tolerance test. The Nature Medicine paper does not throw those tests out. It says, in effect, that the molecular conversation about future diabetes starts much earlier and in many more languages than glucose alone, and that we now have the tools to listen.
It will be years before a 44-metabolite assay sits next to lipid panels in your annual physical. But the conceptual shift — from a single number to a metabolic portrait, from snapshot to trajectory, from fate to ledger — is one you can adopt right now.
This content is for informational purposes only and is not a substitute for professional medical advice, diagnosis, or treatment. Always seek the advice of your physician or other qualified health provider with any questions you may have regarding a medical condition.
References
- Li J et al. Circulating metabolites, genetics and lifestyle factors in relation to future risk of type 2 diabetes. Nature Medicine, January 14, 2026. DOI: 10.1038/s41591-025-04105-8.
- Reynolds A et al. Carbohydrate quality and human health: a series of systematic reviews and meta-analyses. The Lancet, 2019.
- Sutton EF et al. Early Time-Restricted Feeding Improves Insulin Sensitivity, Blood Pressure, and Oxidative Stress. Cell Metabolism, 2018.
- Korean Diabetes Association. Diabetes Fact Sheet in Korea 2022 (referenced for regional context).